


وصف لـ Forex Currency Strength Index
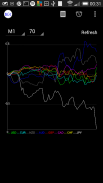
For Forex traders - shows a graph of Absolute Currency Strength (Please read http://en.wikipedia.org/wiki/Absolute_currency_strength to understand the concepts).
Note: the graph looks much better in the ad-free version.
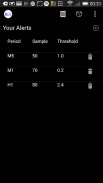
Set a period (eg M1, M15, D1 etc), a sample (steps of 10), and threshold in %. Get an alert when a currency moves above the threshold for the period and sample you selected.
Same thing when a currency becomes weak, and moves below the threshold.
For example:
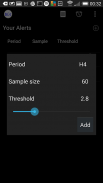
Click on 'Alarm Clock' icon, click the plus sign, see a dialog to add an alert.
Set an alert for M1/50/0.2 - that is for 50 samples on the 1-minute chart, at a threshold of 0.2. Provided the markets are open, you should get an alert very quickly, meaning a currency has moved more than 0.2% in the last 50 minutes.
Second Example:
You set an alert for M5/50/2.0. This means you want an alert when a currency increases OR decreases by 2% on the 5-minute chart, relative to a point 50 5-minute periods before (that is 250 minutes).
So, if USD has increased by 3.5%, and NZD has decreased by 2.1%, you get an alert saying "USD/NZD".
Another example:
You set an alert for H1/30/5.0 - 30 samples on the 1-hour chart, and a threshold of 5% (You need a bigger threshold for longer periods)
Say CAD has decreased 6%, but no currency has increased more than 5% (the threshold you set) - you get an alert saying "-/CAD", meaning no rising currency, CAD is falling.
You get alerts at the end of each period - that is, H1 alerts come at the start of each hour, M30 each half hour etc.
Please leave a comment if you do not understand anything, I will try and help.
Alerts are handled through Google Cloud Messaging, not by polling - so an M1 alert will not be battery heavy, as it is not checking every 1 minute - the server does that.
Disclaimer:
Forex trading is risky, and this is just a tool to help you pick entry points as part of an overall trading strategy. I make no promises that you will become rich through using it, and no liability is accepted for any financial damage incurred.
لتجار الفوركس - يظهر الرسم البياني للقوة المطلقة العملات (يرجى قراءة http://en.wikipedia.org/wiki/Absolute_currency_strength لفهم المفاهيم).
ملاحظة: الرسم البياني تبدو أفضل بكثير في النسخة خالية من الاعلانات.
تحديد فترة (على سبيل المثال M1، M15، D1 الخ)، وعينة (الخطوات من 10)، والعتبة في٪. احصل على تنبيه عندما تتحرك عملة فوق عتبة للفترة وعينة الذي حددته.
نفس الشيء عندما تصبح عملة ضعيفة، ويتحرك تحت عتبة.
مثلا:
انقر على أيقونة "المنبه"، انقر فوق علامة زائد، نرى الحوار لإضافة تنبيه.
تعيين تنبيه لM1 / 50 / 0.2 - وهذا هو ل50 عينة على الرسم البياني لل1 دقيقة، في عتبة 0.2. وفرت الأسواق مفتوحة، يجب أن تحصل على تنبيه بسرعة كبيرة، وهذا يعني أن يحرك العملة أكثر من 0.2٪ في الدقائق ال 50 الماضية.
الثاني مثال:
تعيين تنبيه لM5 / 50 / 2.0. هذا يعني أنك تريد تنبيه عند زيادات العملة أو النقصان بنسبة 2٪ على الرسم البياني 5 دقائق، النسبية إلى 50 نقطة فترات 5 دقائق قبل (وهذا هو 250 دقيقة).
لذلك، ازداد إذا USD بنسبة 3.5٪، وانخفض بنسبة 2.1٪ NZD، وتحصل على تنبيه قائلا "USD / NZD".
مثال آخر:
تعيين تنبيه لH1 / 30 / 5،0 حتي 30 عينات على الرسم البياني 1 ساعة، وعتبة 5٪ (أنت في حاجة عتبة أكبر لفترات أطول)
يقول CAD انخفض بنسبة 6٪، ولكن زاد لم العملة أكثر من 5٪ (عتبة تعيين) - تحصل على تنبيه قائلا "- / CAD"، وهذا يعني لا يوجد ارتفاع العملة، CAD آخذ في الانخفاض.
يمكنك الحصول على تنبيهات في نهاية كل فترة - وهذا هو، وتنبيهات H1 تأتي في بداية كل ساعة، M30 كل نصف ساعة الخ
يرجى ترك تعليق إذا كنت لا أفهم شيئا، وسأحاول والمساعدة.
يتم التعامل مع التنبيهات من خلال جوجل الغيمة التراسل، وليس عن طريق الاقتراع - لذلك سوف تنبيه M1 لا تكون ثقيلة البطارية، كما أنه لم يتم فحص كل 1 دقيقة - الخادم يفعل ذلك.
تنويه:
المتاجرة في الفوركس هو محفوف بالمخاطر، وهذا هو مجرد أداة لمساعدتك على اختيار نقاط الدخول كجزء من استراتيجية التداول الكلي. أنا لا تجعل الوعود التي سوف تصبح غنيا من خلال استخدامه، وتقبل أي مسؤولية عن أي ضرر المالي تكبدها.
Forex Currency Strength Index - إصدار 1.1.8
(09-07-2020)Forex Currency Strength Index - معلومات APK
نُسخة APK: 1.1.8الحزمة: org.philblandford.currencystrengthindexتطبيقات من الفئة نفسها
قد يعجبك أيضًا...


